



Documentation and Examples for Building Strategies
Quantzivo Studio's developer resources are planned to cover the API, Python examples, templates, sample strategies and guides for handling market data correctly.
Quantzivo Studio's developer resources are planned to cover the API, Python examples, templates, sample strategies and guides for handling market data correctly.
Good strategy code depends on knowing exactly what the platform does with your orders and data. Studio's documentation is planned to spell that out: how bars are timed, how fills are modeled, how metrics are defined, and where the limits are.

Product status: Quantzivo Studio is in development. Features described here reflect the planned scope and may change before release.
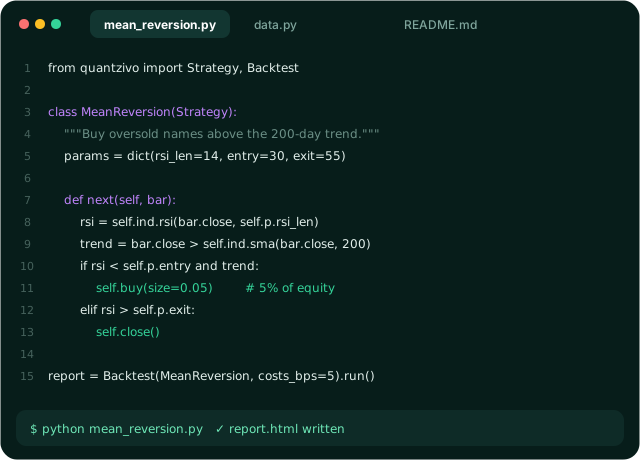


Planned reference for strategy hooks, order types, indicators and backtest settings.

Short, focused scripts that each demonstrate one concept end to end.

Skeleton projects for common strategy structures, ready to adapt.

Annotated educational strategies that show structure and testing, not recommendations.

How to import your own data and export results to notebooks and other tools.

Adjustments, time zones, missing bars and point-in-time data, explained with examples.

Metric definitions, fill models and bias checklists in one place.

Notes on interface changes so existing strategies keep producing comparable results.
These snippets illustrate the planned style of the Python interface. Names and signatures are not final and will change as Studio develops.
Start every project by checking the data. The planned loader is designed to report gaps, duplicate timestamps and unadjusted splits before anything else runs.
from quantzivo import data

bars = data.load_csv("prices/daily.csv", tz="UTC")
report = data.validate(bars)      # gaps, duplicates, bad prices
print(report.summary())

bars = data.adjust(bars, splits=True, dividends=True)A strategy is a class with parameters and a method called once per bar. This educational moving-average example only shows structure; it is not a recommended strategy.
from quantzivo import Strategy

class SmaCross(Strategy):
    params = dict(fast=20, slow=50, size=0.05)

    def next(self, bar):
        fast = self.ind.sma(bar.close, self.p.fast)
        slow = self.ind.sma(bar.close, self.p.slow)
        if fast > slow and not self.position:
            self.buy(size=self.p.size)
        elif fast < slow and self.position:
self.close()Costs, slippage and fill timing are arguments, not hidden defaults. A walk-forward run is designed to report only out-of-sample periods.
from quantzivo import Backtest

bt = Backtest(SmaCross, bars,
              costs_bps=5, slippage_bps=2,
              fill="next_open", benchmark="buy_and_hold")

result = bt.walk_forward(train="3y", test="1y")
print(result.metrics[["cagr", "sharpe", "max_drawdown"]])
# hypothetical results: sensitive to costs, data and parametersNone of these resources are published yet. The list reflects current plans and will evolve with the product.
| Resource | Description | Status |
|---|---|---|
| Getting started | Set up a first project, load sample data and run a first backtest | Planned |
| Strategy API reference | Strategy class, lifecycle hooks, parameters, orders and positions | Planned |
| Indicator reference | Definitions, inputs and warm-up periods for built-in indicators | Planned |
| Backtest configuration | Costs, slippage, fill timing, sizing, benchmarks and sample splits | Planned |
| Metrics glossary | Formulas and caveats for every metric in a Studio report | Planned |
| Data handling guide | File formats, validation, corporate actions, time zones and sessions | Planned |
| Paper trading guide | Virtual portfolios, simulated fills and comparing paper results with backtests | Planned |
| Integration guides | Importing your own data and exporting results to other tools | Planned |
| Strategy samples | Annotated educational strategies with tests and backtest notes | Planned |
| Changelog | Interface changes, deprecations and migration notes | Planned |
Load bars with explicit time zones and session boundaries.

Find gaps, duplicates, zero volumes and impossible prices.

Apply split and dividend adjustments consistently across history.

Line up multiple instruments in time without leaking future values.
These Academy courses cover the Python, strategy design and engineering skills that Studio's developer tools assume.
Learn the Python, pandas and NumPy skills used to load, clean, analyze and visualize market data and compute indicators in code.
Design rule-based strategies, code entry and exit logic, and evaluate them with realistic backtests and performance metrics.
Engineer data-driven fintech applications: financial APIs, market data processing, dashboards and research tooling.
Request early access and share the languages, data formats and examples that would help you most. It helps us prioritize the docs roadmap.
 Strategy Builder
 Algo development
 Backtesting
 Paper trading