


Fundamental Research, from Statements to Peer Comparisons.
Read financial statements over time, track revenue and profitability, compare valuation ratios across peers, and let AI explain what the numbers mean.
Read financial statements over time, track revenue and profitability, compare valuation ratios across peers, and let AI explain what the numbers mean.
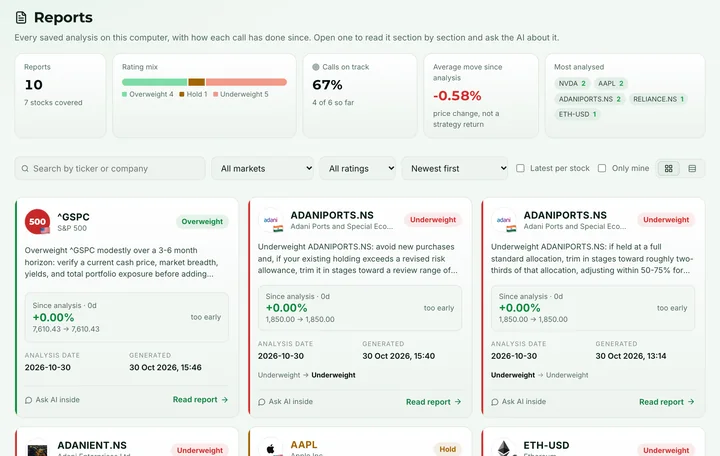
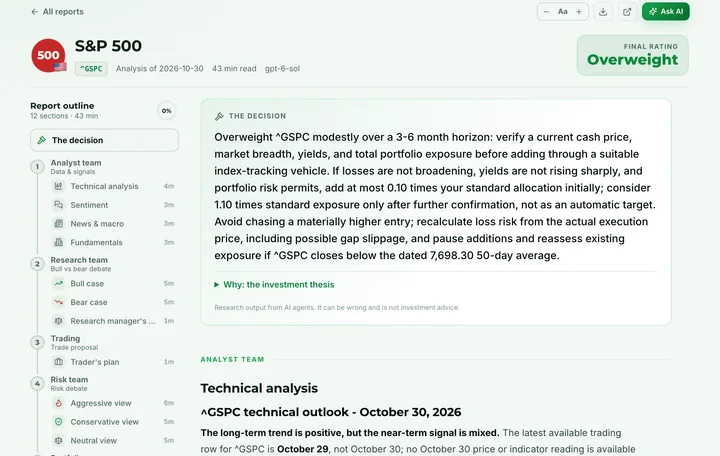

Fundamental research asks what a company earns, how efficiently it operates, how it is financed and how the market values it. The module is designed to lay that out across several years and against comparable companies, so trends stand out.
 Income statement, balance sheet and cash flow in one viewMulti-year trends for revenue, margins and returnsValuation ratios and side-by-side peer tablesAI walkthroughs that explain what changed and why it might matter
 In development

Product status: Quantzivo AI is in development. Features described here reflect the planned scope and may change before release.

Annual and interim statements arranged in consistent tables you can read across periods.

Key operating metrics charted over time so you can see direction, not just a single period.

Year-over-year and multi-year growth, with notes on what can distort the comparison.

Gross, operating and net margins plus returns on equity and assets, period by period.

Price-based and enterprise-value multiples with their history, so today's level has context.

Put several companies in one table and compare growth, margins, leverage and valuation.

See how a company sits within its sector, with median and range figures for the peer group.

Ask the assistant to explain a line item or a change between periods, with the figures linked.
Reading them together is what makes fundamental research reliable. A profit that does not show up as cash, or growth funded by rising debt, is easy to miss in a single table.
Revenue, costs and profit over a period. It shows whether the business earned money and where the costs went.

Assets, liabilities and equity at a point in time. It shows what the company owns, what it owes and how it is financed.

Cash moving in and out from operations, investment and financing. It shows whether reported profit turns into cash.
A ratio compresses two numbers into one. That makes comparison easy, and hides a lot. Definitions also vary between data sources, so check how a ratio was calculated before comparing.
| Ratio | How it is calculated | What it tells you | Watch out for |
|---|---|---|---|
| Price-to-earnings (P/E) | Share price ÷ earnings per share | How much the market pays for each unit of earnings | Meaningless with negative earnings; trailing and forward versions differ |
| Price-to-book (P/B) | Share price ÷ book value per share | Valuation relative to accounting net assets | Less useful for asset-light businesses with large intangibles |
| EV/EBITDA | Enterprise value ÷ earnings before interest, taxes, depreciation and amortization | Valuation that is less affected by how a company is financed | EBITDA ignores capital spending and working-capital needs |
| Gross margin | Gross profit ÷ revenue | How much is left after direct costs of producing goods or services | Companies classify costs differently, which limits comparison |
| Operating margin | Operating income ÷ revenue | Profitability of core operations before interest and tax | Restructuring charges and other one-offs can swing it |
| Net margin | Net income ÷ revenue | Share of revenue that ends up as profit for shareholders | Tax changes and non-operating gains distort trends |
| Return on equity (ROE) | Net income ÷ shareholders' equity | Profit generated on shareholders' capital | High debt can inflate ROE while increasing risk |
| Debt-to-equity | Total debt ÷ shareholders' equity | How much the company relies on borrowing | Whether leases and other obligations count as debt varies |
| Current ratio | Current assets ÷ current liabilities | Short-term ability to meet obligations | A period-end snapshot that can be managed around reporting dates |
| Free cash flow | Operating cash flow - capital expenditure | Cash available after maintaining and growing the asset base | Lumpy investment years can make a single period misleading |
Peer tables are only as good as the peers you choose and the periods you line up. The module is designed to surface these issues instead of hiding them.

Fiscal years end at different times. Compare like-for-like periods or note the mismatch.

Different accounting standards and policies change reported figures for similar businesses.

Companies in the same sector can have very different business models and margins.

Acquisitions, disposals and currency moves can make growth look better or worse than it is.
Start with several years of all three statements to see the shape of the business.
Chart revenue, margins and cash conversion, and ask the assistant to explain any sharp changes.
Place the company next to a sensible peer group and note where it differs and why.

Check recent announcements and the macro backdrop that could explain the numbers.
News Intelligence
Request early access to the fundamental research module and tell us which comparisons matter most to you, or compare the planned AI plans.