


Technical Analysis, Explained as You Explore.
Chart price and volume, layer indicators, compare timeframes and screen markets, with AI that explains what each study measures and where it can mislead.
Chart price and volume, layer indicators, compare timeframes and screen markets, with AI that explains what each study measures and where it can mislead.
Technical analysis turns price and volume history into measurements of trend, momentum and volatility. The module is designed to make those measurements easy to build and, just as important, easy to interpret correctly.
 In development

Product status: Quantzivo AI is in development. Features described here reflect the planned scope and may change before release.
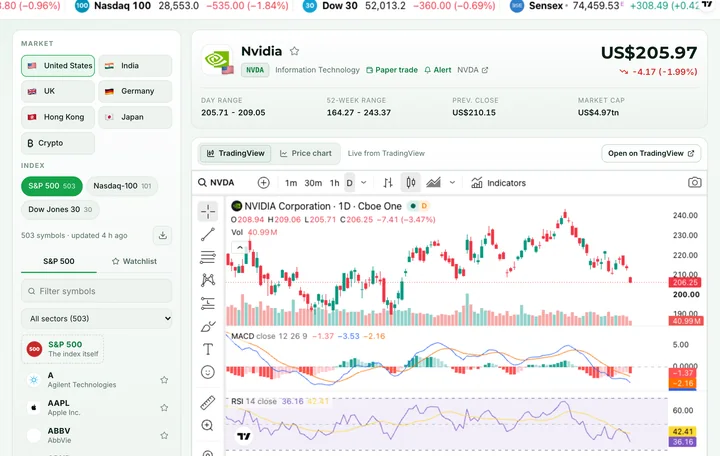

Candlestick, bar and line charts with volume, zoom and adjustable date ranges.

Moving averages, oscillators and bands with parameters you can change and compare.

Study direction and trend strength with moving averages, slopes and trend-strength measures.

Rate-of-change, RSI, MACD and stochastic readings to see how quickly price has been moving.

Average true range, historical volatility and bands to compare today's movement with the past.

View the same instrument on daily, weekly and monthly bars side by side to separate noise from trend.

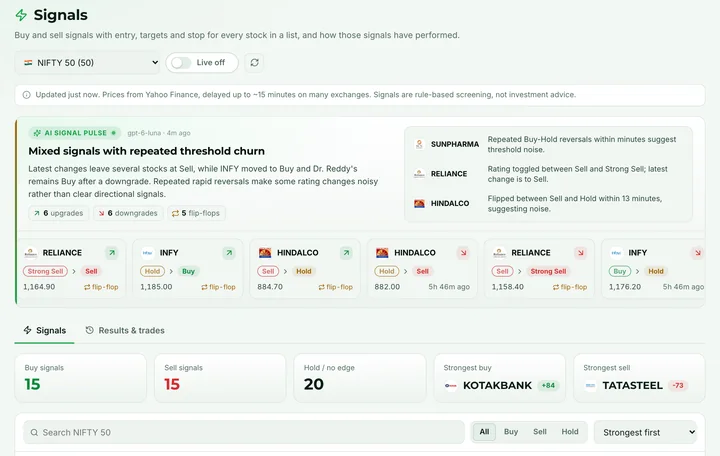
Filter a universe of instruments by indicator conditions to build a shortlist for further study.

Arrange charts and indicator panels for a watchlist into a saved layout you can return to.
Every indicator is a formula applied to past prices. Knowing the formula tells you what it can and cannot see. The assistant is designed to give this kind of explanation for any study on your chart.
| Indicator | What it measures | Common pitfall |
|---|---|---|
| Simple / exponential moving average | The average price over a lookback window; the exponential version weights recent bars more heavily. | Lags by construction. Crossovers can flip back and forth repeatedly in sideways markets. |
| Relative Strength Index (RSI) | The size of recent gains relative to recent losses, scaled from 0 to 100. | Treating 70 as "sell" and 30 as "buy". Readings can stay extreme for long stretches in strong trends. |
| MACD | The gap between a fast and a slow exponential moving average, plus a smoothed signal line. | Double smoothing makes it late, and its values are in price units, so levels are not comparable across instruments. |
| Bollinger Bands | A moving average with bands a set number of standard deviations above and below it. | A touch of a band is not a reversal signal. Bands widen after a move, so they describe volatility after the fact. |
| Average True Range (ATR) | The typical size of a bar's range, including overnight gaps. | Says nothing about direction, and is in price units, so it needs normalizing before comparing instruments. |
| Stochastic oscillator | Where the close sits within the recent high-to-low range. | Very sensitive to the lookback length and noisy on short timeframes. |
| Average Directional Index (ADX) | The strength of a trend, regardless of whether it is up or down. | A high reading does not tell you the direction, and it responds slowly to changes. |
| On-Balance Volume (OBV) | A running total of volume, added on up days and subtracted on down days. | Depends on volume data quality; a single unusual day can dominate the line. |
| Historical volatility | The standard deviation of past returns, usually annualized. | Backward-looking, and the result changes noticeably with the window you choose. |
Choose an instrument, a bar interval and a date range long enough to include different market conditions.
Layer trend, momentum or volatility indicators and adjust their parameters to see how sensitive they are.

Have the assistant describe what each study is showing and which caveats apply to this kind of reading.
AI assistant
An observation on a chart is not evidence. Write it as explicit rules and backtest it with costs in Quantzivo Studio.
BacktestingCompare moving averages and trend strength across timeframes to see whether a short-term move sits inside or against the longer-term direction.
Put current ATR and historical volatility next to their own history to judge whether the market is calm or turbulent by its usual standards.
Screen for a combination of conditions, such as price above a long moving average with rising volume, to decide what to study next.

Indicators summarize the past. A pattern that appeared before is not evidence it will repeat.
Tuning parameters until a chart looks convincing is a fast route to overfitting.

Charts show what happened, not why. News, fundamentals and macro data add the missing context.

Costs, slippage and position sizing decide whether an idea holds up. Only a careful backtest can show that.

Not a signal service. The technical analysis module is a research and learning tool. It does not generate buy or sell signals, and indicator readings are not predictions of future prices.
Request early access to the technical analysis module, or pair it with Academy courses that teach how indicators are built and tested.
 Academy courses