



Backtest Strategies with Assumptions You Can See
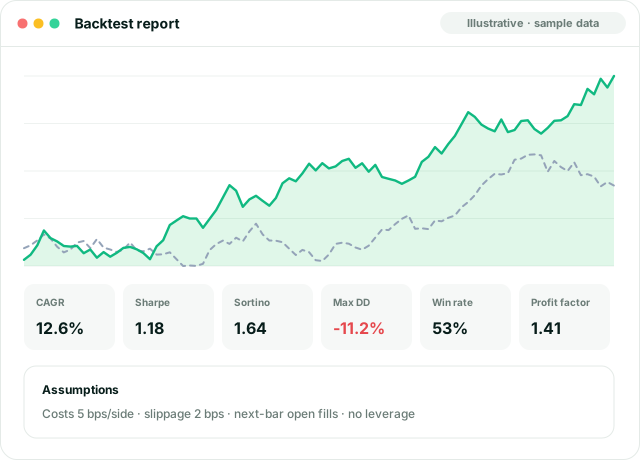
The Backtesting Engine is designed to simulate strategies on historical data with explicit costs, slippage and fill rules, then report the results with their limitations in plain view.
The Backtesting Engine is designed to simulate strategies on historical data with explicit costs, slippage and fill rules, then report the results with their limitations in plain view.
A good backtest cannot tell you a strategy will work. It can tell you, quickly and cheaply, that an idea probably will not. Studio's engine is designed around that purpose: realistic defaults, visible assumptions and metrics that expose weakness rather than flatter it.

Product status: Quantzivo Studio is in development. Features described here reflect the planned scope and may change before release.

Daily and intraday bars, adjusted for splits and dividends, with data-quality checks before a run.

Event-by-event simulation of signals, orders, positions and cash over the chosen period.

Returns, volatility, trade statistics and exposure, calculated with consistent definitions.

Depth, duration and recovery time of every decline from a peak, not just the worst one.

Compare against a buy-and-hold or index benchmark over the identical period.

Sharpe, Sortino and Calmar ratios that weigh return against the risk taken to earn it.

Fixed or volatility-scaled slippage that reflects the gap between signal and fill price.

Commissions, fees and spreads modeled per trade or in basis points of traded value.

Rolling in-sample and out-of-sample windows to check whether results survive new data.
No single metric describes a strategy. Studio reports are planned to show these together, alongside the assumptions that produced them.
| Metric | What it measures | Caveat |
|---|---|---|
| CAGR | Compound annual growth rate of the equity curve | Says nothing about the path; a smooth and a violent curve can share the same CAGR. |
| Annualized volatility | Standard deviation of returns, scaled to a year | Treats upside and downside moves the same and understates rare, large losses. |
| Sharpe ratio | Excess return per unit of volatility | Sensitive to the risk-free rate used and inflated by strategies that rarely lose but lose big. |
| Sortino ratio | Excess return per unit of downside volatility | Can look strong over short samples with few down periods. |
| Calmar ratio | CAGR divided by maximum drawdown | Depends on a single worst episode, so it changes sharply with the test window. |
| Maximum drawdown | Largest peak-to-trough decline in equity | The historical worst case, not a limit; future drawdowns can be deeper. |
| Drawdown duration | Time from a peak until equity recovers to it | Long recoveries are easy to overlook when you only read the depth. |
| Win rate | Share of closed trades that made money | Meaningless without average win and loss size; high win rates can hide large losses. |
| Profit factor | Gross profit divided by gross loss | Highly sensitive to a few outlier trades and to cost assumptions. |
| Exposure | Share of time, or capital, invested in the market | Low exposure can make risk-adjusted ratios look better than the strategy's real risk. |
| Turnover | How much of the portfolio is traded over a period | High turnover multiplies the impact of any error in cost and slippage assumptions. |

Backtested results are hypothetical. They are produced with the benefit of hindsight, rely on assumptions about costs, slippage and fills that may not hold, and do not reflect the impact of real trading. Past simulated performance does not indicate future results.
A strategy that trades often can look excellent with zero costs and lose money once realistic costs are added. That is why the engine is designed to require a cost and slippage setting for every run, and to show how results change as those assumptions get worse.
Walk-forward analysis repeatedly fits a strategy on one window and tests it on the next, which gives a more honest picture than a single optimized run.

Choose parameters using only the first window of history.

Apply those fixed parameters to the following, unseen window.

Shift both windows ahead in time and repeat across the full history.

Evaluate only the combined out-of-sample periods, and compare them with in-sample results.
Each of these can make a weak strategy look strong. Studio is designed to warn about them, but avoiding them still depends on how you research.

Using information that was not available at decision time, such as trading at a close that triggered the signal. Next-bar fills and point-in-time data are the defense.

Testing only on instruments that still exist today, which quietly removes the failures. Universes should include delisted names where data allows.
Tuning rules and parameters until they match past noise. Fewer parameters, out-of-sample tests and stable results across nearby settings help.
Leaving out commissions, spreads and slippage. Even small per-trade costs compound quickly in strategies that trade often.

Testing many variations and keeping the best one. The more you try, the more likely the winner is luck. Keep a log of every test you run.
Assuming every order fills in full at the desired price. Thin markets, gaps and large orders rarely behave that way.
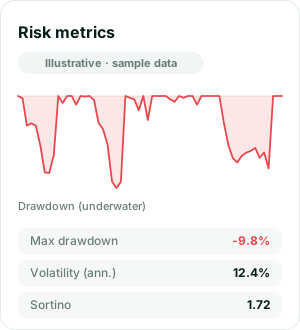
A strategy with a strong return but a long, deep drawdown may be impossible to follow in practice. And a strategy that simply tracks its benchmark with extra costs adds little. Studio's drawdown and benchmark views are designed to surface both questions.
 Underwater chart showing every drawdown and its recoveryStrategy vs. benchmark equity and rolling relative returnYear-by-year and regime-by-regime breakdowns
Request early access to Quantzivo Studio, or build the backtesting skills first with the Academy's Algorithmic Trading with Python course.